


What the datasets for temperature and rainfall?
In Sea-level Rise and You, we display trends in extreme events for temperature and rainfall. While there is extensive information on average climate change, adaptation practice is more strongly driven by changes in extreme events, which place direct pressure on the resilience of coastal communities and ecosystems.(
Note that new for CoastAdapt in 2025 is the inclusions of datasets Cocos Island and Christmas Island.
Using the tool to explore temperature and rainfall data for your area: are you a Wader or a Diver?
If you have used the tool before, you are a Diver

Click to dive straight into Sea-level Rise and You for temperature and rainfall data
If you are a new user of the tool, you are a Wader

If you haven't used this tool before, we suggest you read the general descriptions and guidance below.
Accessing the datasets
Here we outline how to access and use the temperature and rainfall extremes graphs for each coastal council.
On the Sea-level Rise and You page, clicking on the third and fourth tabs takes you to the temperature and rainfall extremes graphs.
header RF
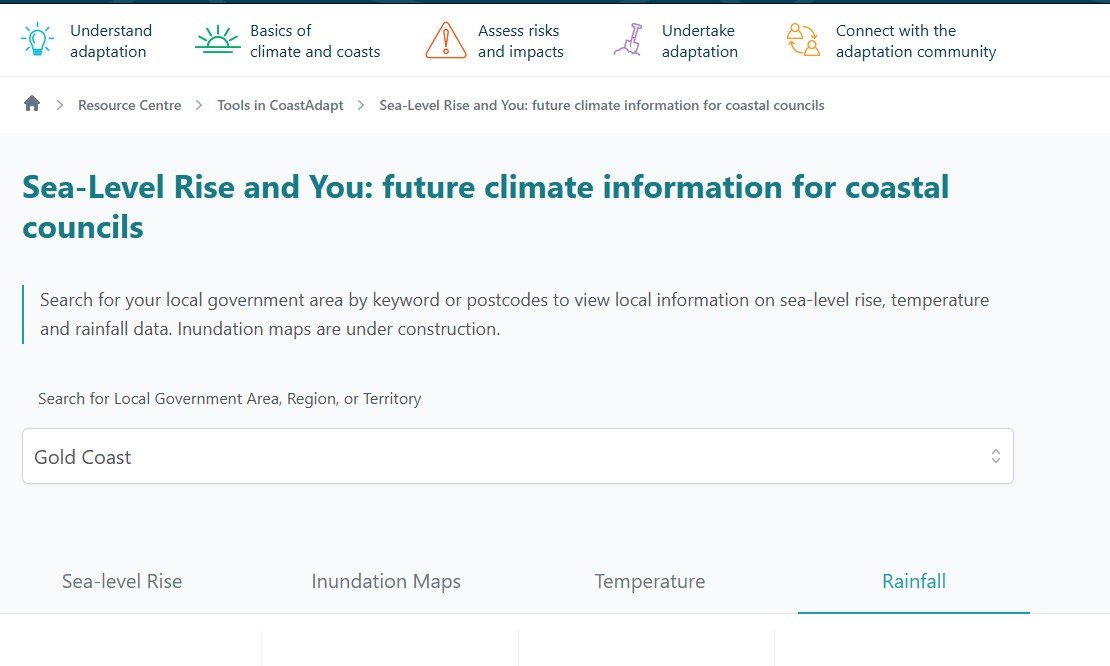
Figure 1. The third tab takes you to temperature and the fourth tab takes you rainfall graphs.

Figure 1. The third tab takes you to temperature and the fourth tab takes you rainfall graphs.
header RF
Figure 1. The third tab takes you to temperature and the fourth tab takes you rainfall graphs.
more information about how the Australian climate may evolve over time (mean and extremes) at Climate Change in Australia
- Data provided are absolute future number of days per year
- Emissions pathways
- SSP1-2.6
- SSP2-4.5
- SSP3-7.0
- SSP5-8.5
- Future time periods
- 2035-3064 (loosely called the '2050s')
- 2070-2099 (loosely called the '2080s')
Temperature datasets
The temperature datasets are hot days, hot nights and heatwaves.
(Note: for heatwaves, there are some changes in how these are computed: read more in the heatwave section below).

Figure 2: Typical temperature extreme graph for the LGA of Gold Coast City Council. (Hot night data not shown here).
Hover over the bars for the details to appear.
- The large dot on the left is the historic average (for the period 1985-2014, loosely called the '2000s').
- The bars show future modelled conditions for the four SSPs over two time slices (2050s and 2080s).
- The dot on the bar is the mean.
- The upper end of the bar is the maximum value and the lower end of the bar the minimum.
- Emissions pathways
- SSP1-2.6 (blue)
- SSP2-4.5 (green)
- SSP3-7.0 (orange)
- SSP5-8.5 (red)
- Future time periods
- 2035-3064 (loosely called the '2050s')
- 2070-2099 (loosely called the '2080s')
screen temp
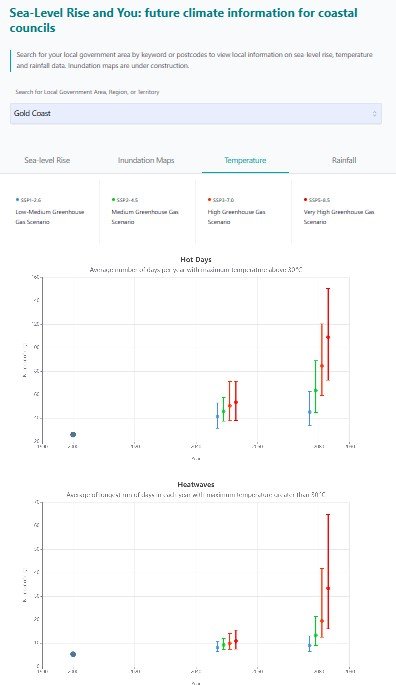
Figure 2: Typical temperature extreme graph for the LGA of Gold Coast City Council. (Hot night data not shown here).
Hover over the bars for the details to appear.
- The large dot on the left is the historic average (for the period 1985-2014, loosely called the '2000s').
- The bars show future modelled conditions for the four SSPs over two time slices (2050s and 2080s).
- The dot on the bar is the mean.
- The upper end of the bar is the maximum value and the lower end of the bar the minimum.
- Emissions pathways
- SSP1-2.6 (blue)
- SSP2-4.5 (green)
- SSP3-7.0 (orange)
- SSP5-8.5 (red)
- Future time periods
- 2035-3064 (loosely called the '2050s')
- 2070-2099 (loosely called the '2080s')
Hot days
- Definition: Average number of days per calendar year with daily maximum temperature greater than 30 °C
- Daily maximum temperatures are usually reached around mid-afternoon.
However, under certain circumstances, maximum daily temperature may occur at other times, including during the night. - The data provided are derived from the BARRA-R2 historic gridded dataset.
- Data for 1985-2014 (loosely, the '2000s') are also provided for comparison purposes.
Hot nights
- Definition: Average number of days per calendar year with daily minimum temperature greater than 25 °C.
- Daily minimum temperatures are usually reached overnight, commonly in the hour or so before sunrise.
However, under certain circumstances, it is possible that the minimum daily temperature can occur at other times, even during the day. - Data for 1985-2014 (loosely, the '2000s') are also provided for comparison purposes.
Heatwaves
- Definition: Average duration of the longest run of consecutive days per calendar year with daily maximum temperature above 30 °C
- Data for 1985-2014 (loosely, the '2000s') are also provided for comparison purposes
- Notes:
- In some northern Australian locations, heatwaves by this definition can persist for longer than a year. In these cases, the number is capped at 365 days.
- Any heatwave that spans the December/January period is included in both years.
Changes to calculating heatwaves leads to note of caution for heatwave data.
Through the data checking process, some discrepancies were identified between the new heatwave dataset (v2) and that published on the original CoastAdapt website (v1). These discrepancies are due to changes in how the heatwaves were calculated (see below).
This has resulted in some large discrepancies identified between historical values for the dataset in CoastAdapt version 1 (2016) and CoastAdapt version 2 (2025) due to changes in how the heatwaves were calculated (see below).
- For example:
- Exmouth (WA): v1 = 50 days compared to v2 = 101 days.
- Cairns (Qld): v1 = 32 compared to v2 = 9.57 days
- Bellingen (NSW): v1 = 10 days compared to v2 = 2.17 days
- Darwin (NT): v1 = 154 days compared to v2 = 84.73 days (noting AGCD has issues at Darwin)
- Other locations with similar discrepancies include:
- Bundaberg (Qld)
- Colac Otway (Vic)
- Albany (WA)
- Bunbury (WA).
- Changes to the version 2 algorithm for calculating heatwaves, include:
- heatwaves that span 31 December and 1 January are included in the calculations for both years (previously the heatwave was assigned only to the year that contains ‘day 1’ of the heatwave)
- heatwaves that have a duration of greater than one year (as can occur in northern Australia) are capped at 365 days.
Rainfall datasets
The rainfall data sets are Dry months (a proxy for drought conditions) and Very wet days.
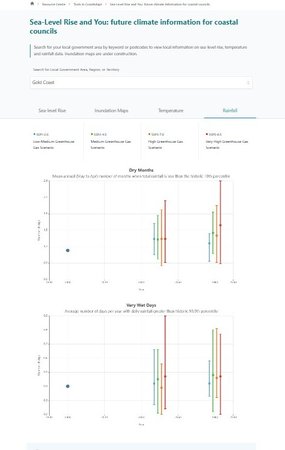
Figure 3: Typical rainfall extreme graph for the LGA of Gold Coast City Council.
Hover over the bars for the details to appear.
- The large dot on the left is the historic average (for the period 1985-2014, loosely called the '2000s').
- The bars show future modelled conditions for the four SSPs over two time slices (2050s and 2080s).
- The dot on the bar is the mean.
- The upper end of the bar is the maximum value and the lower end of the bar the minimum.
- Emissions pathways
- SSP1-2.6 (blue)
- SSP2-4.5 (green)
- SSP3-7.0 (orange)
- SSP5-8.5 (red)
- Future time periods
- 2035-3064 (loosely called the '2050s')
- 2070-2099 (loosely called the '2080s')
rainfall
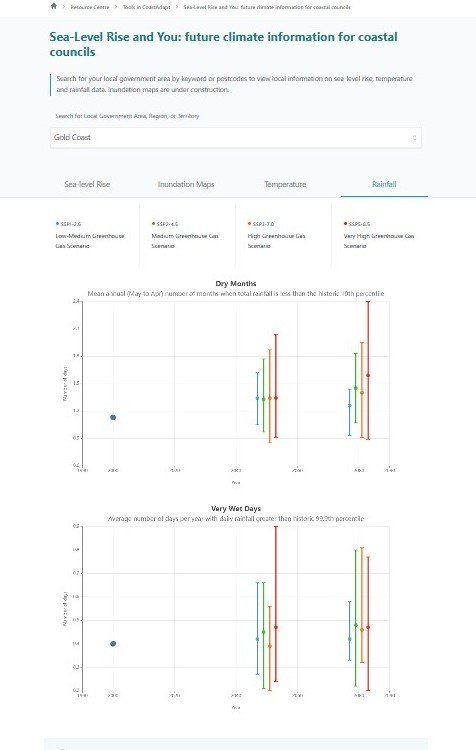
Figure 3: Typical rainfall extreme graph for the LGA of Gold Coast City Council.
Hover over the bars for the details to appear.
- The large dot on the left is the historic average (for the period 1985-2014, loosely called the '2000s').
- The bars show future modelled conditions for the four SSPs over two time slices (2050s and 2080s).
- The dot on the bar is the mean.
- The upper end of the bar is the maximum value and the lower end of the bar the minimum.
- Emissions pathways
- SSP1-2.6 (blue)
- SSP2-4.5 (green)
- SSP3-7.0 (orange)
- SSP5-8.5 (red)
- Future time periods
- 2035-3064 (loosely called the '2050s')
- 2070-2099 (loosely called the '2080s')
Dry months
- Definition: Average number of months in a 12-month period (May to April) where the monthly total rainfall is within the historic 10th percentile (also known as the 1st decile) of monthly rainfall in the reference period (1979-2024)
- Data provided are absolute future number of days per year (May to April)
- The historical period used for calculating the 10th percentile was 1979-2024
- Data for 1979-2024 (loosely, the '2000s') are also provided for comparison purposes
- Notes: This is a measure that can be used to describe drought conditions and is reported routinely by the Bureau of Meteorology.
- The period May to April was chosen by NCCARF in response to user needs to reduce the likelihood of dry spells being split across adjacent years.
Very wet days
Definition: Average number of days per calendar year with daily rainfall greater than historic 99.9th percentile of daily rainfall in the reference period (1979-2024)
- The historical period used for calculating the 99.9th percentile was 1979-2024
- Data for 1979-2024 (loosely, the '2000s') are also provided for comparison purposes.
Modified method for Cocos Island and Christmas Island
Modified method for Cocos Island and Christmas Island
These data were calculated separately using the BARRA-R2 11 km version of the gridded data. This was necessary because the 5 km version does not extend to the Cocos (Keeling) and Christmas Islands.
Acknowledgements
The temperature and rainfall extremes data were provided by CSIRO in a project led by John Clarke and Dr Malcolm King from CSIRO and NESP Climate Services. Information on the derivation of these datasets is available in this Technical Note from CSIRO.