


At a glance
Smartline helps coastal decision makers to:
- identify and compare coastal landform types along the entire Australian coastline
- screen coastlines for relative sensitivity to erosion, recession and sea‑level rise
- support coastal management, land‑use planning and adaptation planning at regional scales
- prioritise locations for monitoring, modelling or more detailed local assessment.

If are you are a 'Diver', i.e. an experienced user of Smartline, dive straight into using the dataset in Shoreline Explorer
If you are a Wader, i.e. new to Smartline, we suggest you read the background and guidance below.
What is Smartline?
The Smartline GIS dataset represents the coastline as a series of discrete alongshore segments. Each segment carries multiple attributed fields describing the dominant subtidal, intertidal and backshore landforms and geological characteristics that dominate a coastal zone. Attributes apply to a coastal zone extending nominally 500 m landward and seaward of the High Water Mark.
Each segment begins and ends where there is a significant change in any of the landform characteristics along the coastline, such as the beginning or end of a sandy beach. See Figure 1 and Figure 2
Smartline is distributed as a polyline dataset and through web services, which enables it to be integrated with other spatial coastal datasets.

Figure 1: Multiple layers of information about the coastal zone can be attributed to a single digital line map that represents the coastline. The correct alongshore extent of each attribute is preserved by segmenting the line wherever any one of the attributes change.
Smartline 1
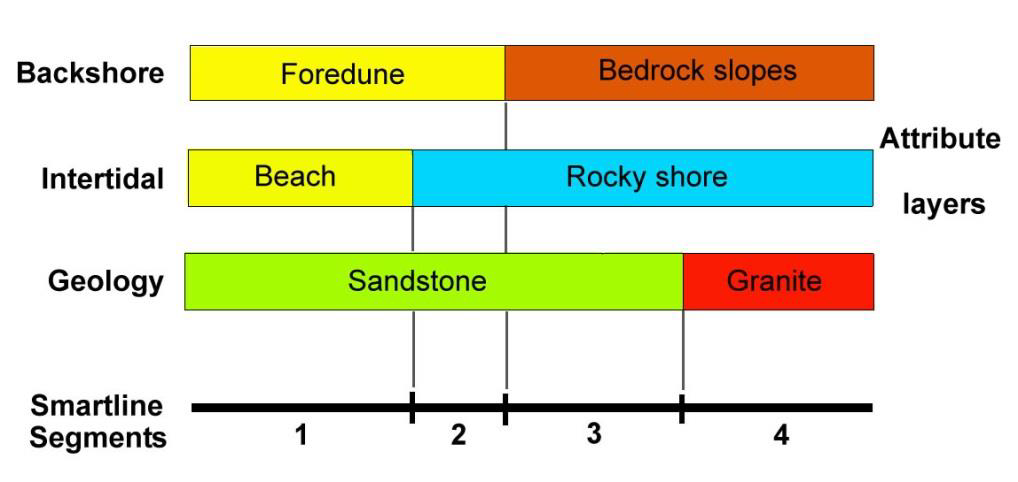
Figure 1: Multiple layers of information about the coastal zone can be attributed to a single digital line map that represents the coastline. The correct alongshore extent of each attribute is preserved by segmenting the line wherever any one of the attributes change.
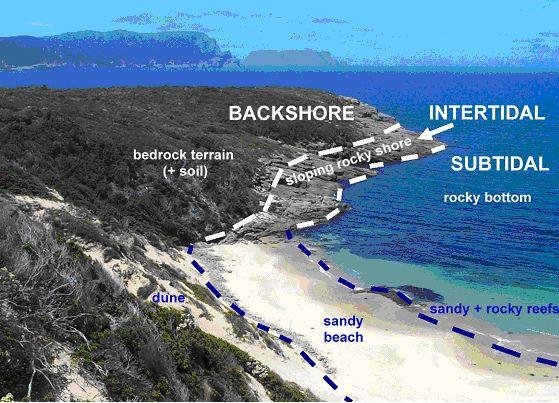
Figure 2: In its more detailed attributes, Smartline describes the landforms of the coastal zone in terms of three shore-parallel tidally-defined zones indicated in this figure.
Landforms within each of these zones are described using two descriptive attribute fields plus another field describing the overall zone profile or slope.
The two simpler levels of detail provided in Shoreline Explorer within the CoastAdapt tool do not display these attributes separately, but instead amalgamate them into simpler characterisations of the coastal zone.
For example, the two main coastal segments in this figure would be characterised as ‘Sloping hard rock shore backed by bedrock’ and ‘Sandy beach backed by dunes over bedrock’.
Smartline 2

Figure 2: In its more detailed attributes, Smartline describes the landforms of the coastal zone in terms of three shore-parallel tidally-defined zones indicated in this figure.
Landforms within each of these zones are described using two descriptive attribute fields plus another field describing the overall zone profile or slope.
The two simpler levels of detail provided in Shoreline Explorer within the CoastAdapt tool do not display these attributes separately, but instead amalgamate them into simpler characterisations of the coastal zone.
For example, the two main coastal segments in this figure would be characterised as ‘Sloping hard rock shore backed by bedrock’ and ‘Sandy beach backed by dunes over bedrock’.
The need for a nationally consistent dataset
The Smartline coastal geomorphic dataset of Australia was created during 2007 – 2009 to meet the need for a single detailed and nationally consistently dataset of coastal landforms for the entire Australian coast. It was designed to support regional‑scale coastal management, hazard assessment and strategic planning where consistent baseline information was required.
Smartline was compiled without undertaking new field mapping. Instead, it draws on and synthesises information from more than 200 existing coastal mapping datasets, which differed in purpose, spatial scale and classification approach. These datasets were extracted, reclassified and integrated to produce a standardised national representation of coastal landforms.
The format of representing detailed descriptive coastal landform information as multiple attributes within a simple digital (GIS) line map was chosen over the more traditional two-dimensional or polygon map format. A GIS polyline format was deliberately selected in preference to conventional polygon mapping.
The rationale for this approach:
- it provided a practical method of compiling a new national dataset within a limited time frame
- the essentially linear nature of coastlines makes the GIS line map an efficient format that can capture, represent and extract many types of useful coastal information.
Although some types of coastal information do require polygon maps and digital elevation models, the ease with which a simple line map can efficiently capture and display many types of useful coastal information has led to it being referred to as the ‘Smartline’ format.
Limitations
The accuracy and level of detail of the landform and geological information provided in the Smartline dataset is as accurate as the source datasets from which it has been compiled. However, these vary in nature and detail and therefore, are known to have some data gaps and generalisations, particularly in regions where there was limited geomorphic mapping was limited at the time of compilation: for example, parts of the Northern Territory and Gulf of Carpentaria.
Updates and refinements have been applied since the initial release of Smartline: however spatial detail continues to reflect the limitations of underlying source data in areas with sparse baseline mapping.
The Smartline project was undertaken by researchers at the University of Tasmania, led by Chris Sharples, and developed in collaboration with Geoscience Australia, which now maintains and distributes the dataset.
Simplified Smartline layers
The Smartline format supports the storage of detailed geomorphic and geological information to be recorded in multiple attributed fields. However, this detailed information to be ‘distilled’ down into simpler, broader landform categories represented by just a few or even just a single map attribute or layer. This information can be useful for screening, communication and high‑level assessment, using a reduced number of attributes or map layers.
Smartline in CoastAdapt
In CoastAdapt, Smartline is presented as one of three datasets in Shoreline Explorer. Smartline is presented through two map layers that provide different levels of geomorphic detail, which allows users to select an appropriate scale for their purpose.
- Smartline Basic: At the broadest (simplest) level, Smartline Basic presents a single map layer that can be used to display the coast classified into just five high-level landform categories: these are based on very broad differences in the composition and erodibility of coastal landforms. This layer is suited to national or regional screening, communication and early‑stage prioritisation.
- Smartline Advanced: At the higher level of level of detail, Smartline Advanced presents separate layers that show the location and extent of more differentiated but still quite broadly defined coastal landform types or groups. These can include landforms such as hard rocky shores (of several types e.g. cliffed and sloping), sandy beaches (e.g. backed by bedrock or by soft sediment terrain), soft-rock shores of several types, and others.
Both these layers represent simplified views of the Smartline dataset and draw on a subset of the full attribute information available in the underlying GIS data, which should be consulted directly for more detailed analysis.
When would I use Smartline information?
- use Smartline Basic to orient decision makers and define the problem
- use Smartline Advanced to prioritise locations and justify further investigation
- treat both as screening tools, not as predictive or design datasets.
Smartline should be used as a regional‑scale planning and assessment tool, with its application guided by the scale and purpose of the decision‑making context. It supports understanding of broad coastal behaviour and is intended for screening, sensitivity analysis and prioritisation, rather than site‑specific prediction or engineering design. Therefore it should not be considered a predictive or design tool.
Smartline is particularly suited to assessing regional and national patterns of coastal sensitivity to sea‑level rise, erosion and shoreline recession. Users can select between Smartline Basic and Smartline Advanced, which apply the same underlying geomorphic information at different levels of detail to suit a range of planning and strategic assessment needs.
Choosing the appropriate Smartline layer: Basic or Advanced
Selecting the appropriate Smartline layer depends on whether the task requires broad contextual understanding or greater discrimination between coastal behaviours.
Typical practitioner uses of the two layers are summarised in the table.
| Aspect | Smartline Basic | Smartline Advanced |
|---|---|---|
| Primary purpose | High‑level overview and initial screening | Regional‑scale discrimination and prioritisation |
| Level of detail | Very broad landform classification (5 classes) | Greater differentiation between coastal landform types |
| Best suited to | Scoping, framing and communication | Comparative regional assessment and planning |
| Typical questions addressed | What type of coast is this? Is it generally rocky or erodible? | Which coastal areas warrant closer attention? |
| Application for planning | Strategic context and briefings | Coastal management programs and adaptation planning |
| Role in risk screening | First‑pass identification of potentially sensitive coast | Screening for relative sensitivity to erosion, recession or instability |
| Role in climate adaptation | Broad framing of exposure | Differentiating responses to sea‑level rise and wave exposure |
| Typical next step | Apply Smartline Advanced or local data | Targeted modelling, monitoring or field studies |
The level of detail provided by Smartline Advanced allows practitioners to distinguish between broadly defined but different coastal behaviours; for example, erodible sandy beaches exposed to or sheltered from swell‑wave action, resilient sloping hard‑rock shores, and instability‑prone soft‑rock coasts. This can support spatial prioritisation, helping to identify where further investigation or management attention is most warranted.
It is important to note that Smartline does not provide estimates of the rate or magnitude of shoreline response (such as erosion rates or recession distances). These outcomes require process‑based modelling, local datasets and site‑specific investigation. Smartline should therefore be used as a screening and sensitivity framework, not as a predictive or design tool.
Integration with other datasets
Smartline information can be used in conjunction with sediment compartment descriptions to extend assessment of beach sensitivity to short, medium and long-term timeframes and help to prioritise management actions.
Together with other datasets relating to the shoreline, Smartline can be combined with shoreline datasets, wave exposure information, inundation mapping and sea level rise scenarios to support coastal hazard assessment, climate risk evaluation and adaptation planning.
Online tools provide a simpler, read‑only view. These are useful for exploring the data, explaining patterns, and supporting planning‑level decisions, but not for detailed analysis.
However, If you want to do detailed or customised analysis, you need to work with the Smartline data in GIS software. This lets you ask specific questions of the data, combine it with other datasets, and look closely at individual attributes.
How to access Smartline
the Smartline dataset within Shoreline Explorer
more general information about Shoreline Explorer and its other datasets
Smartline Basic
Step 1: Click the box in Shoreline Explorer for the dataset you want to use. In this case Smartline Basic. A legend will appear that shows the categories of erodibility (see Figure 3).

Figure 3: Key for Smartline Basic: categories of erodibility
Smartline Basic 1

Figure 3: Key for Smartline Basic: categories of erodibility
Step 2: Find your area of interest either by typing the name of the place in the search box (top right hand corner of the map), or by zooming in using your mouse or the zoom slider. A coloured line will appear showing the extent of the erodibility characteristic selected.
Step 3: If you are interested in any particular place or point, you can click directly on the coloured line at that place of interest. The key will indicate the erodibility at that point.

Figure 4: The key shows that the pink line on the map is 'Dominantly sandy shores (very high erodibility)'and the green line on the map is ' Dominantly hard rock shores (low erodibility)'.
Smartline basic 2
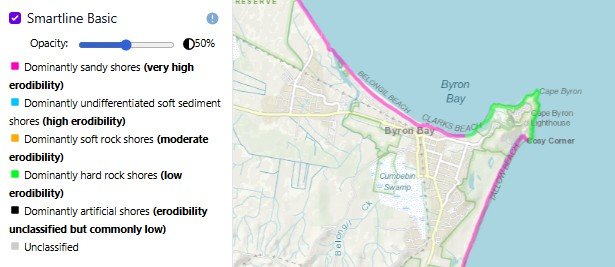
Figure 4: The key shows that the pink line on the map is 'Dominantly sandy shores (very high erodibility)'and the green line on the map is ' Dominantly hard rock shores (low erodibility)'.
Smartline Advanced
Step 1: Click the box in Shoreline Explorer for the dataset you want to use. In this case Smartline Advanced.
Step 2: In the drop-down box, select one of the geomorphic types you are interested in. For each geomorphic type you select, a key will appear below showing the colour scheme for various geomorphic attributes.

Figure 5: In choosing 'sandy' coasts, this key comes up.
SmartlineAdv_sandy
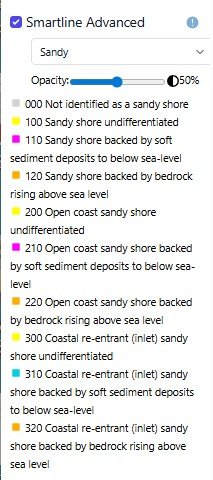
Figure 5: In choosing 'sandy' coasts, this key comes up.
Step 3: If you are interested in a specific place or point, you can click directly on the coloured line at that place of interest.
Even more advanced...
Smartline can also be used at an even more detailed level than the two described above, using further attributes that classify coastal landform attributes in greater detail.
To use Smartline effectively at this higher level of detail you need to have some experience using the dataset and to be familiar with both GIS techniques generally and the Smartline Data Model specifically.