


At a glance
- Sea‑level rise allowances are risk‑based height increments added to present‑day water levels to ensure the frequency of coastal flooding or inundation does not increase over time, despite rising mean sea levels.
- Allowances account for uncertainty in sea‑level projections and local extreme sea‑level variability (tides, storm surge, waves), so they are often higher than median sea‑level rise projections, especially for long‑term planning.
- They are used by councils, planners, and engineers to guide minimum floor levels, setbacks, infrastructure design, and coastal hazard mapping, particularly for assets with long lifespans.
What is a sea-level rise allowance?
A sea‑level rise allowance is a risk‑based vertical buffer added to existing water levels so that the likelihood of flooding or coastal inundation stays the same in the future as it is today.
In practical terms, it answers the question: “How much higher do we need to build, protect, or set back assets so that future extreme sea‑level events are no more likely than they are now?”
Allowances account for mean sea-level rise, consider uncertainty in climate projections and include local variability in tides, storm surge and wave effects.
Because of the uncertainty, allowances are often larger that the projections of median sea-level rise, especially for high value or long-lived infrastructure.
more about sea-level allowances in the Climate Change in Australia
How are allowances calculated
Calculating allowances generally follows the guidance developed by CSIRO and the Climate Change in Australia.
Allowances are calculated by:
- Taking projected sea‑level rise under current emissions scenarios
- Combining this with local extreme sea‑level statistics (tides, surges)
- Applying probability theory so that future exceedance frequency matches present‑day exceedance frequency.
A worked example
Figure 1 illustrates the relationship between extreme sea-level variability and return periods for two different coastal locations under present-day conditions.
- Location A has large variability in extreme sea levels due to the large variation in the tidal cycle and a tendency for large storm surges to occur.
- Location B has little variation in tidal cycle and a tendency for smaller surges when storms occur, and hence lower variability overall. In terms of the return periods for storm tides (the combination of storm surge and astronomical tide)
- Location A is characterised by a steeper return period curve than Location B,
- The statistical relationships that are represented in these return period curves describe the probability that an exceedance event will occur in a given year.
- Location A shows a smaller change in the probability that an exceedance event will occur in any year than Location B, for the same rise in sea level (Church et al., 2016).
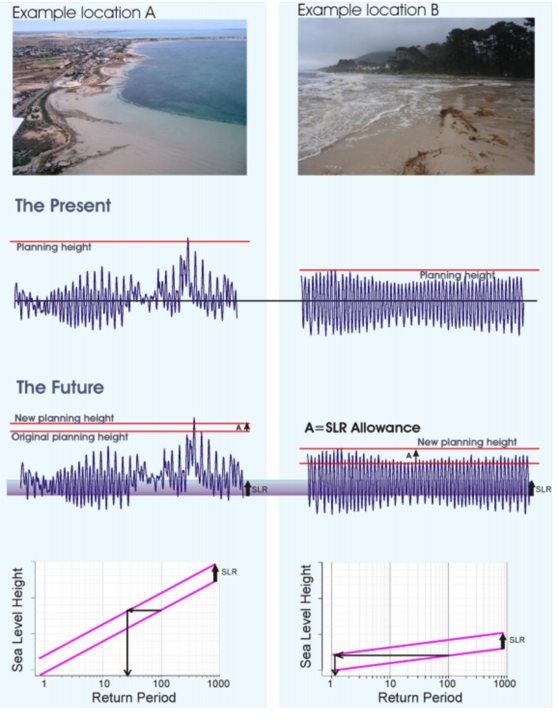
Figure 1. Two different coastal locations with different extreme sea-level variability. The causes of extreme sea levels varies from place to place and determines present planning heights. Under sea-level rise, the increase in threshold exceedance varies from place to place.
Photo A courtesy of Professor Nick Harvey and Photo B courtesy of Dr Penny Whetton.
- © CSIRO 2016.Allowances

Figure 1. Two different coastal locations with different extreme sea-level variability. The causes of extreme sea levels varies from place to place and determines present planning heights. Under sea-level rise, the increase in threshold exceedance varies from place to place.
Photo A courtesy of Professor Nick Harvey and Photo B courtesy of Dr Penny Whetton.
© CSIRO 2016.
How allowances are applied in practice
In the near term (around 2030–2050), sea‑level rise allowances are generally close to the median projected sea‑level rise, as uncertainty between scenarios remains relatively low. By the long term (around 2100), growing uncertainty in projections means allowances typically shift toward the upper end of the projected range to maintain current levels of flood risk.
Allowances are used in several ways
In coastal hazard and risk assessment, allowances can be used for
- coastal erosion and inundation modelling
- flood risk mapping
- emergency planning scenarios.
In land use planning, allowances can be used to:
- assess development applications so that new structures are safe over the expected lifespan
- define coastal hazard or flood planning overlays
- determine development setbacks
- restrict new development in high‑risk areas.
In infrastructure and planning design, allowances can inform
- design heights for roads, ports, wastewater plants, levees, seawalls
- freeboard levels for bridges and drainage systems
- timing or sequencing for asset replacement and upgrade.
Why allowances matter
Sea‑level rise projections describe how much the ocean might rise, while allowances focus on how to avoid increasing coastal risk as that rise occurs.
Because allowances are designed to maintain present‑day levels of risk, they are typically more conservative, help prevent future generations from being locked into unsafe development, and provide a robust and defensible basis for planning and legal decisions.
Typically, allowances are higher for critical infrastructure than private developments because of the severe consequences if such infrastructure fails.
Jurisdictional differences
State governments set benchmarks for guidance for councils to interpret.
Currently,
- New South Wales: councils are required to use locally justified allowances based on accepted science (often IPCC‑aligned). (NSW did have a state benchmark that was revoked in 2012).
- Tasmania has formally derived probabilistic planning allowances tied to risk thresholds and exposure periods. Read more in the 2012 report.
- Victoria: uses a planning benchmark of ~0.8 m by 2100 for planning purposes.
- Western Australia: embeds allowances directly into coastal planning policy formulas that include erosion and inundation components
more about jurisdictional differences in the state adaptation pages