


At a glance
- Cays are low-lying sedimentary islands that provide high-value habitats for nesting seabirds and marine turtles, and endemic vegetation species within the Great Barrier Reef Marine Park.
- The management of these high-value habitats will benefit from meaningful quantitative geomorphic change metrics that inform the necessity and appropriateness of management intervention.
- Compared with traditional methods of shoreline analysis, the Reef Island Geomorphic Activity Assessment enables managers to quantify the magnitude and rate at which cays undergo geomorphic change.
- This enables the vulnerable areas of a cay to be identified to target management interventions.
Cays change constantly and we need to monitor that change
Cays are dynamic landforms that are constantly adjusting to external forcing conditions. Traditional shoreline analysis methods have been developed for application to linear mainland coastlines and do not necessarily capture change around 360° cay shorelines.
We have developed a new method, the Reef Island Geomorphic Activity Assessment (RIGAA), which accounts for change to the entire cay footprint area and includes several metrics to quantify change at various spatial and temporal scales.
They demonstrate how the RIGAA metrics can be used to meaningfully inform the appropriate and sustainable management of high-value ecosystem services that cays support by applying to two contrasting sites, Masthead Island, a large (47 ha) vegetated cay, and Taylor Cay, a small (0.84 ha) unvegetated cay.
This case study demonstrates the application of a novel method for quantifying cay geomorphic change, emphasising meaningful outputs to inform appropriate and sustainable management interventions.
The Great Barrier Reef (GBR) Marine Park covers an area of approximately 345,500 km2 which includes more than 300 cays (low-lying reef islands) (Figure 1a). These cays are high-value landforms, providing habitat for nesting seabirds (Figure 1b) and marine turtles (Figure 1c), as well as endemic vegetation such as Pisonia (Figure 1d).
However, cays are dynamic landforms that are constantly adjusting to variable external forcing conditions. As climate changes, it is unclear how cays will respond to modifications in these external conditions. In an effort to predict how cays will behave under climate change conditions, we must first understand their dynamics in response to present conditions.
The Reef Island Geomorphic Activity Assessment (RIGAA) method enables quantification of cay morphodynamics.

Figure 1. Map of the Great Barrier Reef (a) within the context of the Queensland coast and showing the distribution of cays throughout the marine park, including (b) seabirds at Michaelmas Cay, (c) nesting marine turtle tracks at Heron Island, and (d) Pisonia forest at Lady Musgrave Island.
- © E. LazarusCays_image 1

Figure 1. Map of the Great Barrier Reef (a) within the context of the Queensland coast and showing the distribution of cays throughout the marine park, including (b) seabirds at Michaelmas Cay, (c) nesting marine turtle tracks at Heron Island, and (d) Pisonia forest at Lady Musgrave Island.
© E. Lazarus
A new method to measure cay geomorphic change
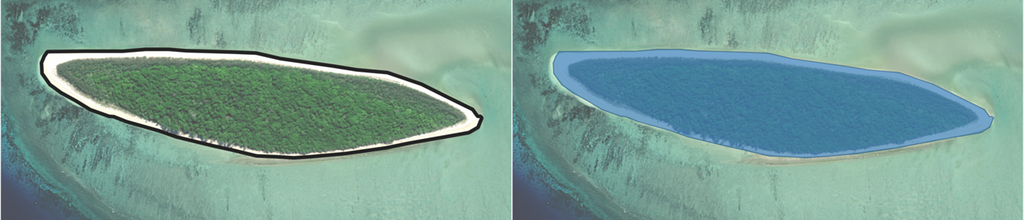
Globally, geomorphic change on cays has traditionally been measured as a rate of shoreline change. The Digital Shoreline Analysis System (DSAS) is used to calculate the net shoreline movement (NSM) or a shoreline change envelope (SCE) at discrete cross-shore transects spaced at regular intervals along a reference shoreline (Figure 2a). However, these metrics are not intuitively measured or presented in such a way that is appropriate to inform the management of cays
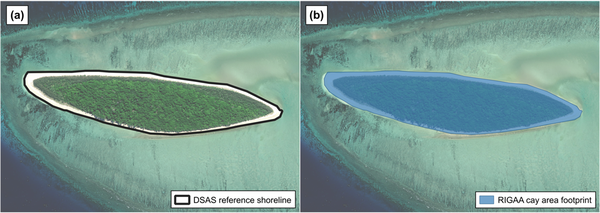
Figure 2. A comparison demonstrating the different metric inputs: (a) the reference shoreline for the Digital Shoreline Analysis System (DSAS), and (b) the cay area footprint for the Reef Island Geomorphic Activity Assessment (RIGAA).
- © E. LazarusCays_image 2
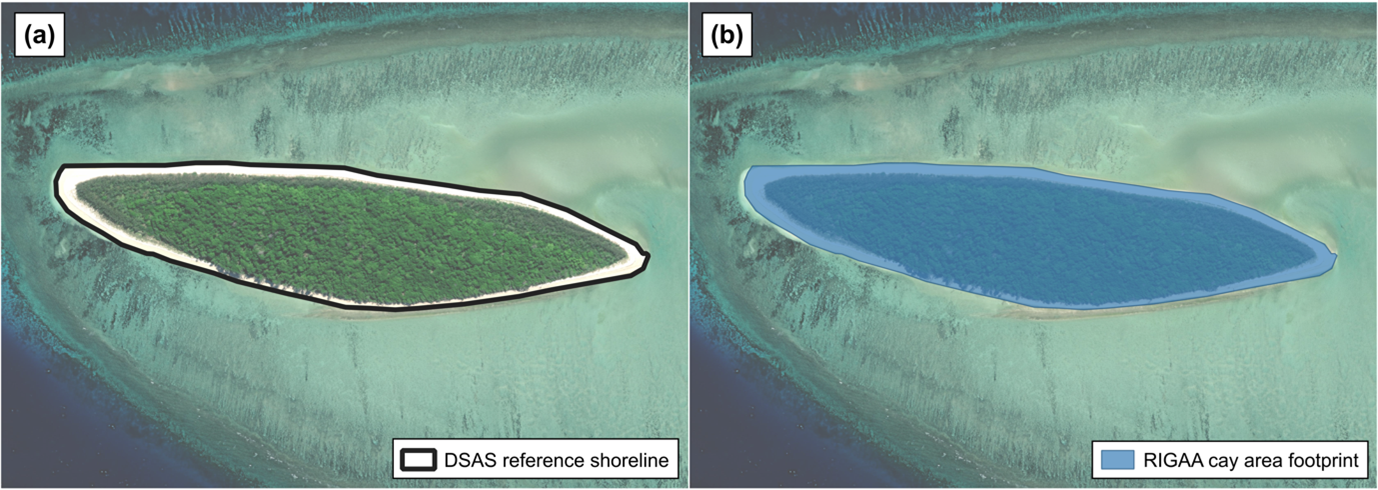
Figure 2. A comparison demonstrating the different metric inputs: (a) the reference shoreline for the Digital Shoreline Analysis System (DSAS), and (b) the cay area footprint for the Reef Island Geomorphic Activity Assessment (RIGAA).
© E. Lazarus
The Reef Island Geomorphic Activity Assessment (RIGAA) is a new method that has been developed using the entire cay footprint (Figure 2b), rather than a shoreline, to understand and quantify cay geomorphic change over seasonal, event-based and inter-annual scales depending on the user’s timeframe of interest.
The metrics of RIGAA include net cay change, historical cay footprint intersection (proportion of cay overlap and maximum historical overlap), cay orientation, and cay migration. RIGAA metrics are presented with reference to area which better relates to the preservation of ecological values which are typically measured by the area they occupy.
a detailed description of the metrics in Lazarus et al. (2025).
the DSAS and RIGAA metrics in Table 1.
| Digital Shoreline Analysis System | Reef Island Geomorphic Activity Assessment |
|---|---|
| Net shoreline movement (NSM): | Net cay change: |
| * Distance between the oldest and youngest shoreline positions in the analysis period. | * Change in cay area between the oldest and youngest timesteps, including areas of progradation, recession or relative stability. |
| Shoreline change envelope (SCE): | Historical cay footprint intersection: |
| * Greatest distance of shoreline position movement along a transect | 1) Aggregated area of all cay footprints for the entire analysis period. |
| 2) The percentage of cay footprints that have overlapped at a given area with respect to the total number of cay footprints of the analysis period. | |
| 3) Identifies the area of overlapping cay footprints as a proportion of the historical cay positional envelope. |
Application of the method and implications for management
To illustrate the difference in approaches to quantify cay geomorphic change, we present two contrasting examples of cay geomorphic activity: Masthead Island, a large (47 ha) vegetated cay, and Taylor Cay, a small (0.84 ha) unvegetated cay. The DSAS metrics of NSM and SCE will be compared with the RIGAA metrics of net cay change and historical cay footprint intersection, respectively.
The trajectory of cay geomorphic change can be predicted from net cay change (RIGAA) or the NSM (DSAS). Where the DSAS shows transects of net positive (prograding) or negative (receding) shoreline change, RIGAA measures and presents areas of net change. The NSM measurements can be averaged over all transects to inform an overall shoreline change. The average NSM at Masthead Island is 4.1 m (Figure 3a) and 13.1 m at Taylor Cay (Figure 3b). These averages indicate a net positive (expansion) trajectory for both cays. In particular, the transects indicate negative shoreline change (recession) on the south-facing shoreline of Taylor Cay and positive shoreline change (progradation) along the north-facing shoreline. In contrast, the RIGAA metrics indicate a net change of 2.9 % (relative stability) at Masthead Island (Figure 3c) and contraction (net change -32.8 %) at Taylor Cay (Figure 3d).
The RIGAA and DSAS both capture the south-facing shoreline recession and north-facing shoreline progradation at Taylor Cay. However, RIGAA, in addition, captures the complete relocation of Taylor Cay on the reef platform. This relocation is misrepresented by DSAS as shoreline progradation and the DSAS results do not intuitively present the dynamic nature of Taylor Cay.
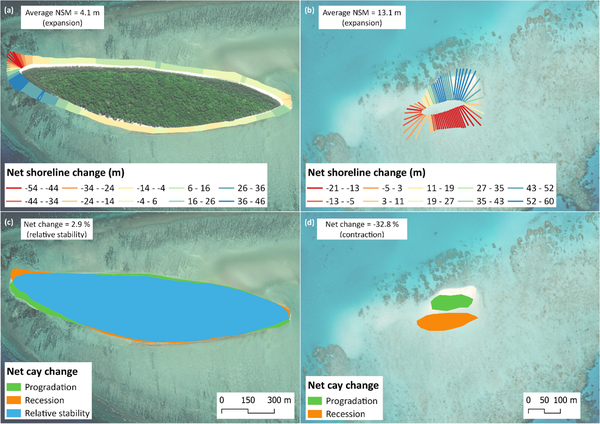
Figure 3. Comparing the metrics of net cay change between Digital Shoreline Analysis System (DSAS) for (a) Masthead Island and (b) Taylor Cay, and Reef Island Geomorphic Activity Assessment (RIGAA) for (c) Masthead Island and (d) Taylor Cay. Note: the scales of NSM are different for Masthead Island (a) and Taylor Cay (b). Note: there is no area of relative stability at Taylor Cay.
- © E. LazarusCays _image 3
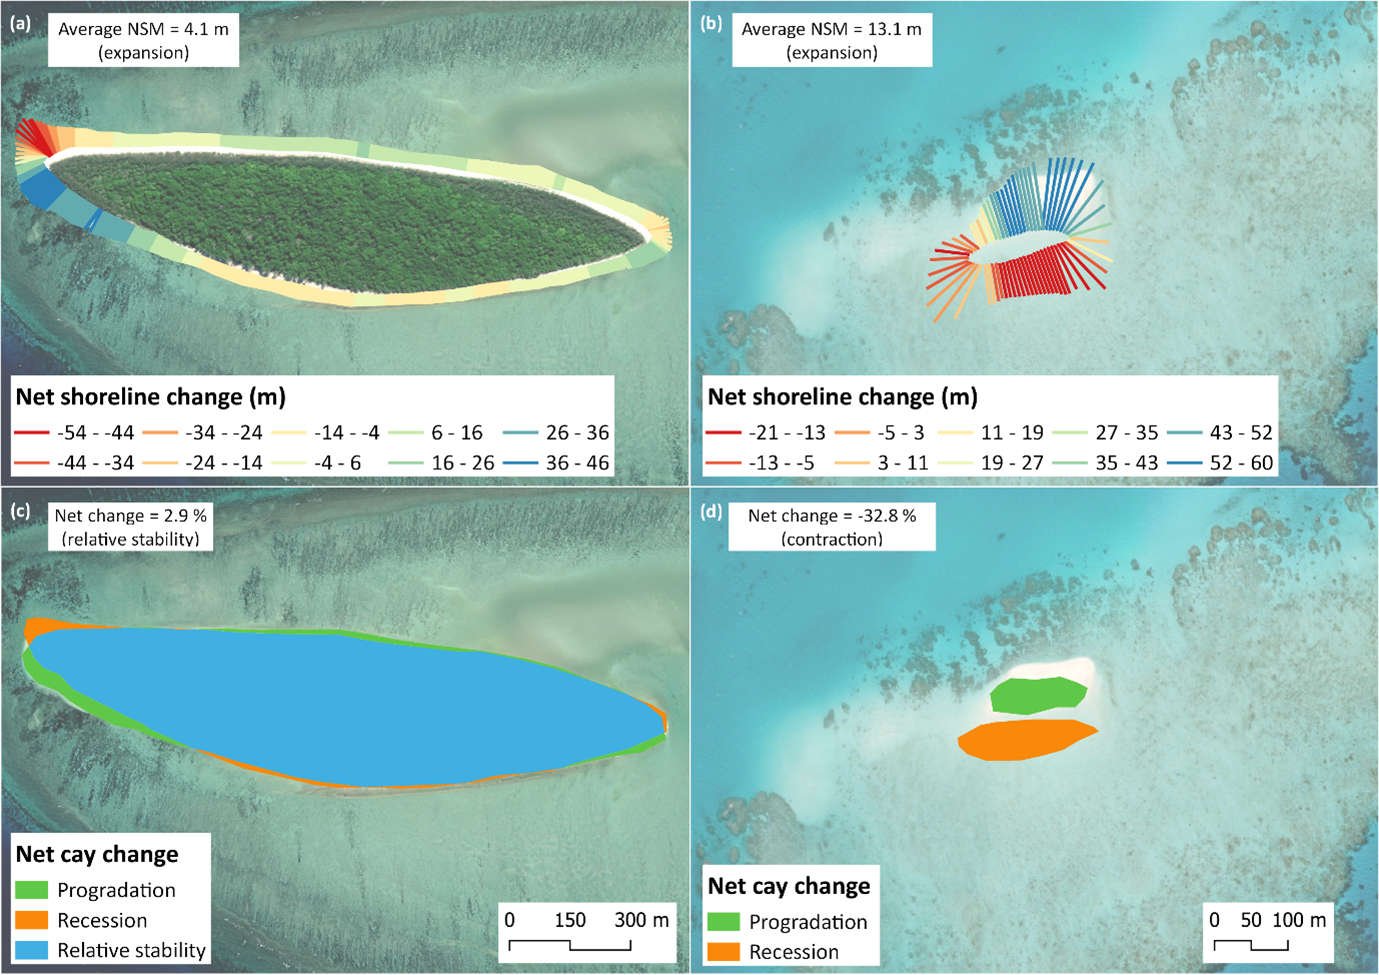
Figure 3. Comparing the metrics of net cay change between Digital Shoreline Analysis System (DSAS) for (a) Masthead Island and (b) Taylor Cay, and Reef Island Geomorphic Activity Assessment (RIGAA) for (c) Masthead Island and (d) Taylor Cay. Note: the scales of NSM are different for Masthead Island (a) and Taylor Cay (b). Note: there is no area of relative stability at Taylor Cay.
© E. Lazarus
At Taylor Cay, the average overall SCE is 63.5 m, indicating a large envelope of shoreline change when compared to Masthead Island (Figure 4c). As with Masthead Island, the use of an average overall SCE measure misrepresents the sections of shoreline where the SCE is <40 m and >100 m. Moreover, the presentation of the SCE transects suggests that there is a central core of Taylor Cay that remains stable over the analysis period.
However, the RIGAA demonstrates that there are no sections of Taylor Cay that overlap for 100 % of the analysis period (Figure 4d). The largest proportion of cay overlap (62.65 %) represents 3.2 % of the historical cay positional envelope (maximum historical overlap).
These results indicate a highly dynamic cay and suggest that Taylor Cay regularly migrates over the reef flat.
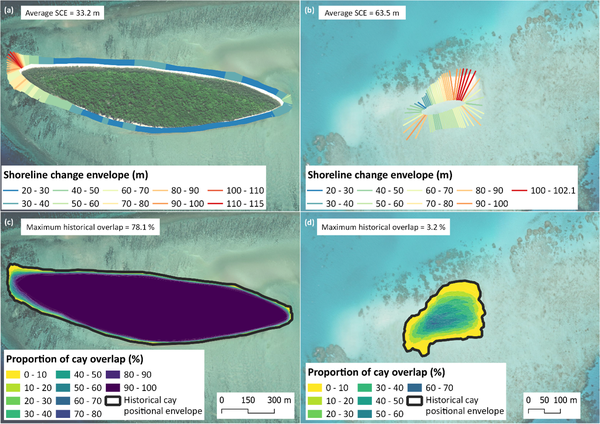
Figure 4. Understanding the magnitude and frequency of cay shoreline dynamics using the DSAS Shoreline Change Envelope (SCE) at (a) Masthead Island and (b) Taylor Cay, in comparison with the historical cay footprint intersection, which measures the proportion of cay overlap and maximum historical overlap, at (c) Masthead Island and (d) Taylor Cay.
- © E. LazarusCays_image 4
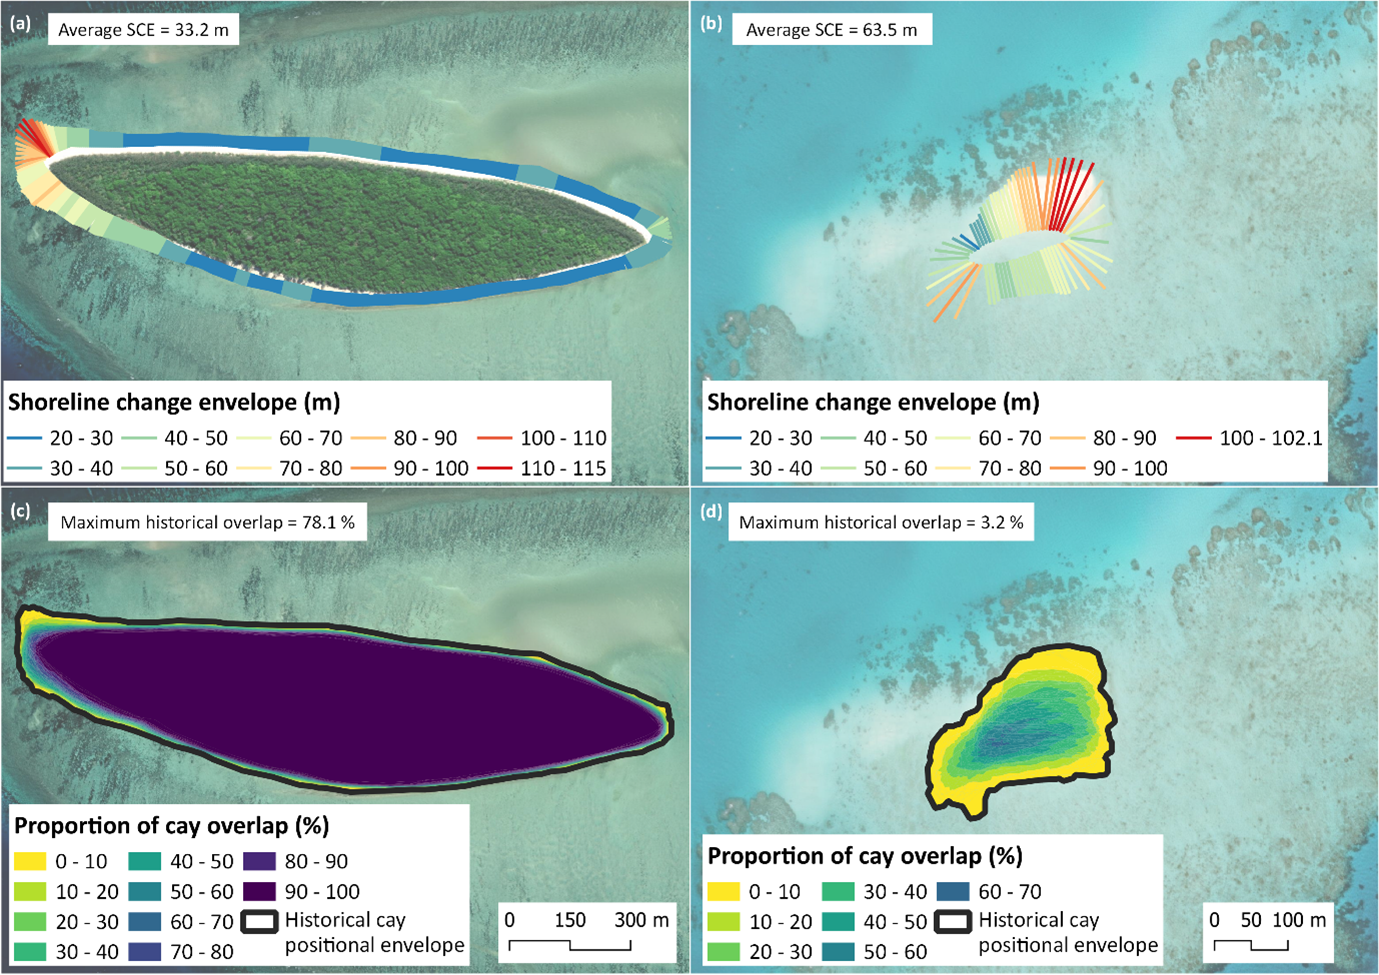
Figure 4. Understanding the magnitude and frequency of cay shoreline dynamics using the DSAS Shoreline Change Envelope (SCE) at (a) Masthead Island and (b) Taylor Cay, in comparison with the historical cay footprint intersection, which measures the proportion of cay overlap and maximum historical overlap, at (c) Masthead Island and (d) Taylor Cay.
© E. Lazarus
Interpreting the metrics
To effectively implement management intervention, it is imperative to appropriately measure potential cay trajectories (e.g., net expansion or contraction), and understand the magnitude and frequency of cay morphodynamics. The RIGAA metric of net cay change can be considered the first step to identifying potential cay morphodynamic trajectories and determining whether management intervention may be required.
We have demonstrated that the net cay change is a more appropriate metric than NSM, particularly in the case of dynamic cays where there may be complete relocation of the cay across the reef platform, such as at Taylor Cay (Figure 3d). The net cay change identifies the overall trajectory of change occurring (i.e. net expansion, contraction or relative stability), and measures the proportion and locations of change.
This information can be used to determine the ongoing capacity to support high-value ecosystem services such as endemic vegetation (e.g. the tree Pisonia common on larger coral cays) which require continuous occupation and thus a relatively stable cay area. It should be noted that complete cay relocation or highly dynamic cays do not necessarily indicate a reduced capacity to support other high-value habitats such as seabird or marine turtle nesting areas.
Net cay change can be used in conjunction with the maximum historical overlap to provide an indication of the stable proportion of the historical cay positional envelope where a high value suggests a relatively stable cay and the ongoing ability to support valuable habitats, including nesting seabirds and marine turtles, as well as endemic vegetation. This metric can also be used to compare between sites and thus prioritise management intervention.
The historical cay footprint intersection (RIGAA) metrics (Table 1) provide a measure of the frequency of fluctuations to cay shorelines or footprints. The proportion of cay overlap provides an indication of which sections of a cay undergo change, and the frequency at which that change occurs.
For example, at Masthead Island, there is a spit on the western end of the cay (Figure 4c), however the size and position of the spit has fluctuated over the period of analysis as indicated by the lighter shading. Therefore, placement of hard structures or renourishment or grading is inappropriate at this location as it is likely to be unsustainable. However, targeted analysis can provide insight into the morphodynamics of a cay during key seasons, such as bird nesting months.
This targeted analysis will indicate whether there is ongoing capacity of the cay to support high-value ecosystem services at key time periods and with reference to the sections of the cay supporting these services. It can also inform whether targeted intervention during these key periods would be sustainable. Thus, the RIGAA can be used based on the user’s timeframe of interest to best inform management decisions.
Recommendations
We demonstrate how to apply the Reef Island Geomorphic Activity Assessment using two contrasting examples of cays within the GBR. This new method can be applied to reef islands globally, irrespective of the geographic setting.
As reef islands globally become increasingly vulnerable to the impacts of climate change, this new method can be used by managers to inform appropriate and sustainable management interventions to preserve valuable ecosystem services.
To cite:
This case study was prepared by Emily Lazarus, James Cook University. Please cite as: Lazarus, E. 2024: Quantifying change in cay geomorphology to inform management strategies within the Great Barrier Reef. Case study for CoastAdapt, National Climate Change Adaptation Research Facility, Griffith University, Gold Coast.